In this post we assume the the reader knows the basics of debugging with Visual Studio:
- F5 to start running with the debugger
- F9 set breakpoint on the current line
- F10 run till next breakpoint
- F5 to resume the execution from a stopped program debugged
- F11 step into the function (if the instruction pointer points to a function)
- F10 step over the function (if the instruction pointer points to a function)
- Shift+F11 step out the executed function
- Pause execution
- Attach to Process
- Quick watch an element in source code with mouse hover
- Debug Windows : Locals, Watch, Immediate, Modules, Stack Trace, Exception
Many developers handle their debugging sessions with this powerful-enough knowledge kit. However the Visual Studio Debugging tools have much more to offer. Here is a list of Visual Studio Debugging productivity tips. Note that those tips and shortcuts have been validated with Visual studio 2019 16.6 EN-US edition with no extension installed.
1) Run to Cursor
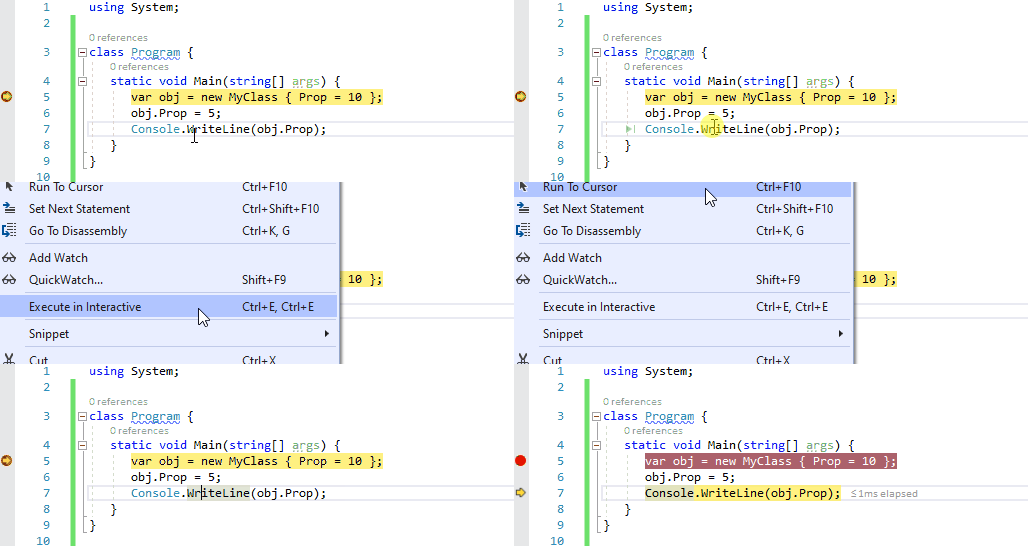
With the shortcut Ctrl+F10 you can tell the debugger to run until the line pointed by the cursor.
2) Run through here with a mouse click
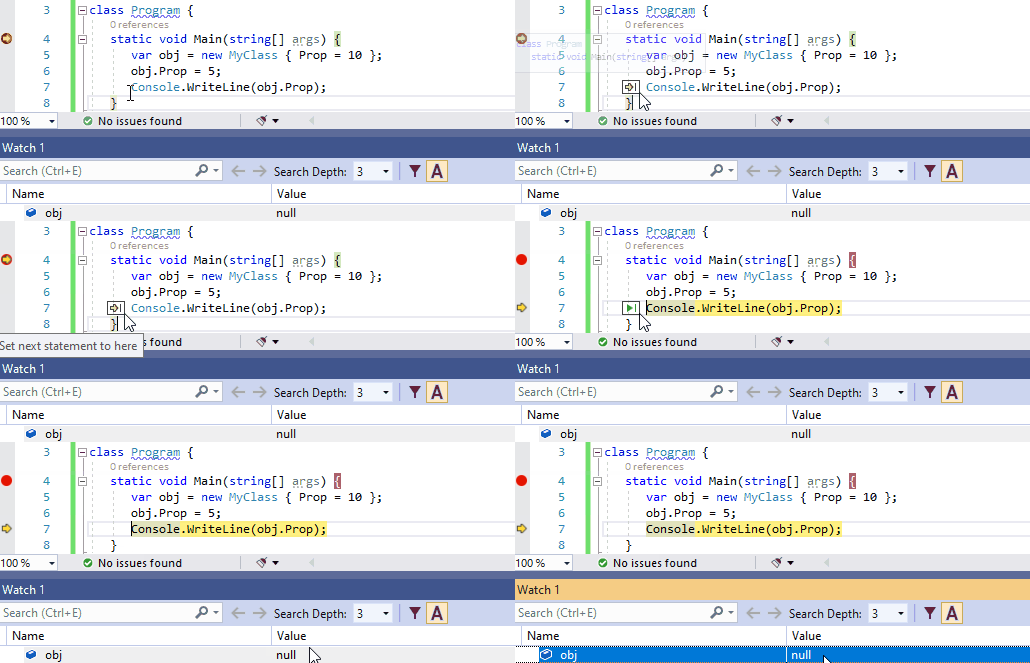
When hovering the source code while debugging a Run execution through here green glyph appears. This glyph can be clicked.

3) Set next statement to here
The Run execution through here green glyph can be transformed into Set next statement to here by holding the key Ctrl. It is different than Run execution through here because the statement in between are not executed. Hence in the small animation below we can see in the Watch window that the reference obj remains null: the MyClass constructor in between hasn’t been executed.
4) Data breakpoint: Break when value changes
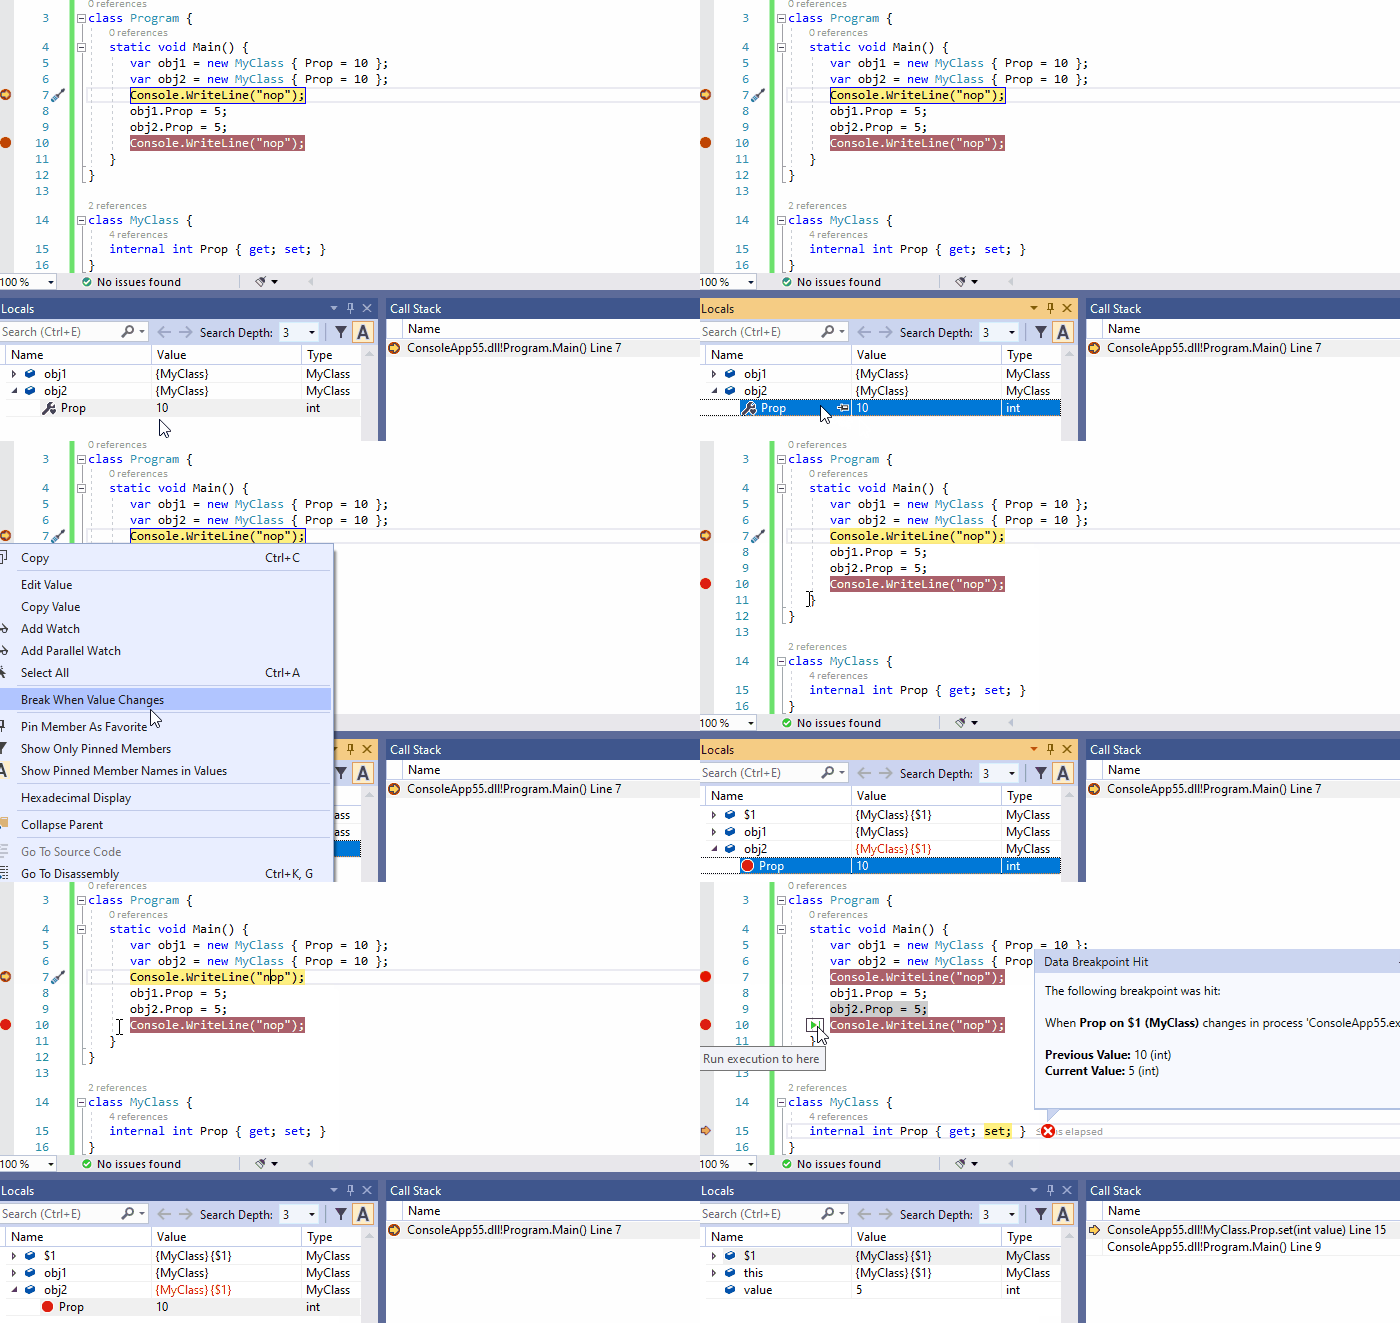
If you set a breakpoint to a non-static property setter it will be hit when changing the property value for all objects. The same behavior can be obtained for a single object thanks to the Locals (or Watch) window right click : Break When Value Changes menu.
This facility is illustrated with the animation above. The hit occurs only when obj2.Prop is changed, not when obj1.Prop is changed.
Note that a data breakpoint is bound to a live object during a debugging session. Hence it gets lost once the debugged process stops, it cannot be reused during future debugging session.
Note that the menu Break When Value Changes is also available when right clicking a field in the Locals window but unfortunately the debugger doesn’t break on field change, I am not sure if it’s a bug or a feature not yet implemented?
5) Conditional breakpoint
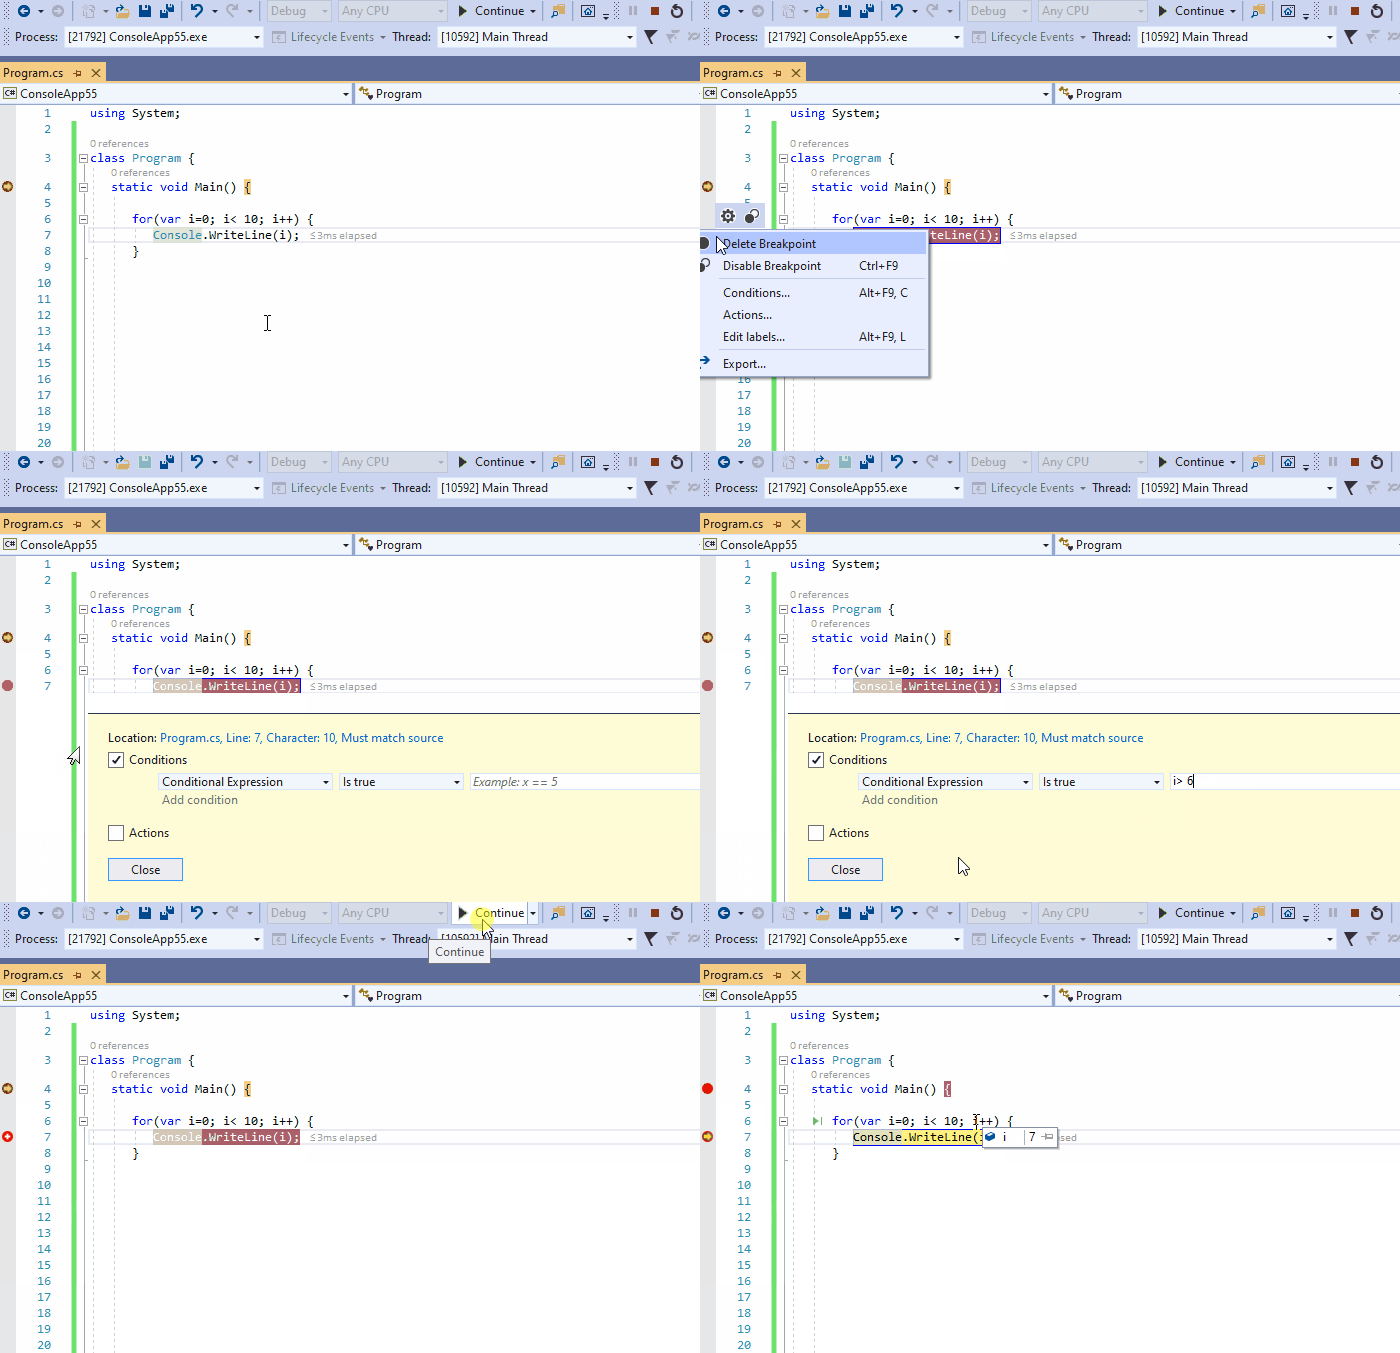
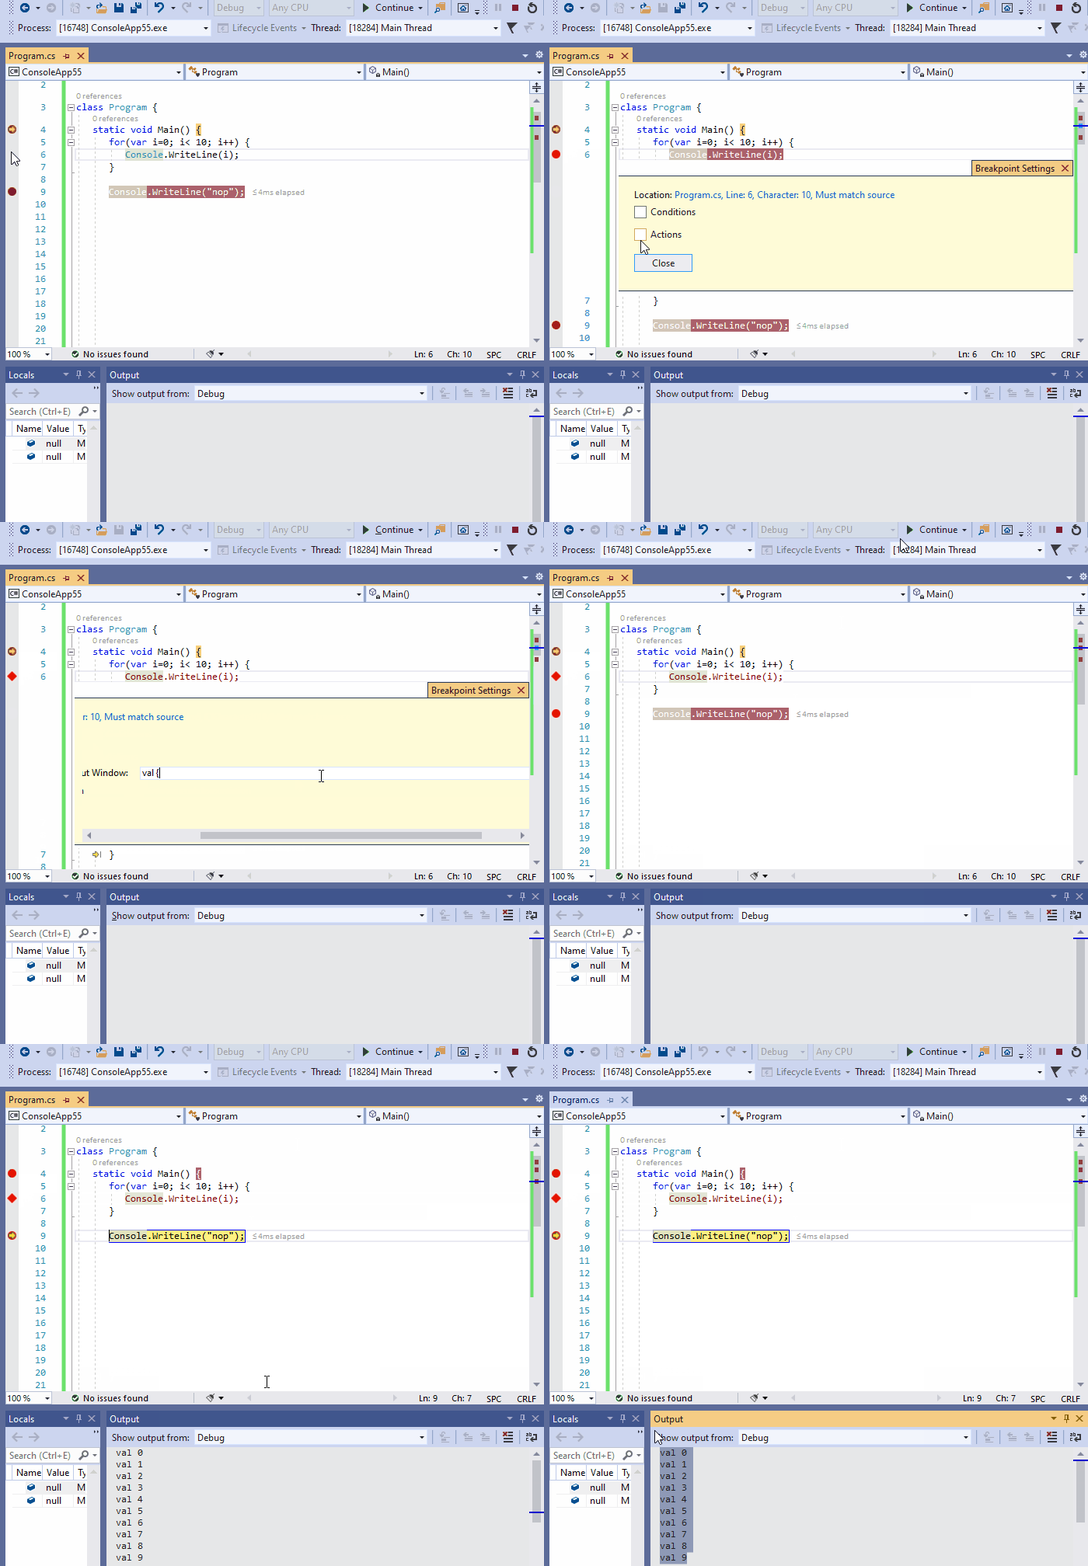
A condition can be attached to a breakpoint to break only in a certain scenario. In the animation below we define the breakpoint with condition i > 6 within the loop. Then we click Continue and can see that once the breakpoint is stopped, the i value is actually 7.
6) Trace breakpoint
Halting the program execution is the most common action upon a breakpoint hit. However you can choose instead to print some traces in the Output window without (or with) halting. This possibility is illustrated by the animation below where we trace the value of i from 0 to 9 in the Output window. Notice that a trace breakpoint has the diamond shape in the code editor gutter.
Note that both a condition and a trace action can be specified on a breakpoint.
7) Track Objects that Are Out-Of-Scope
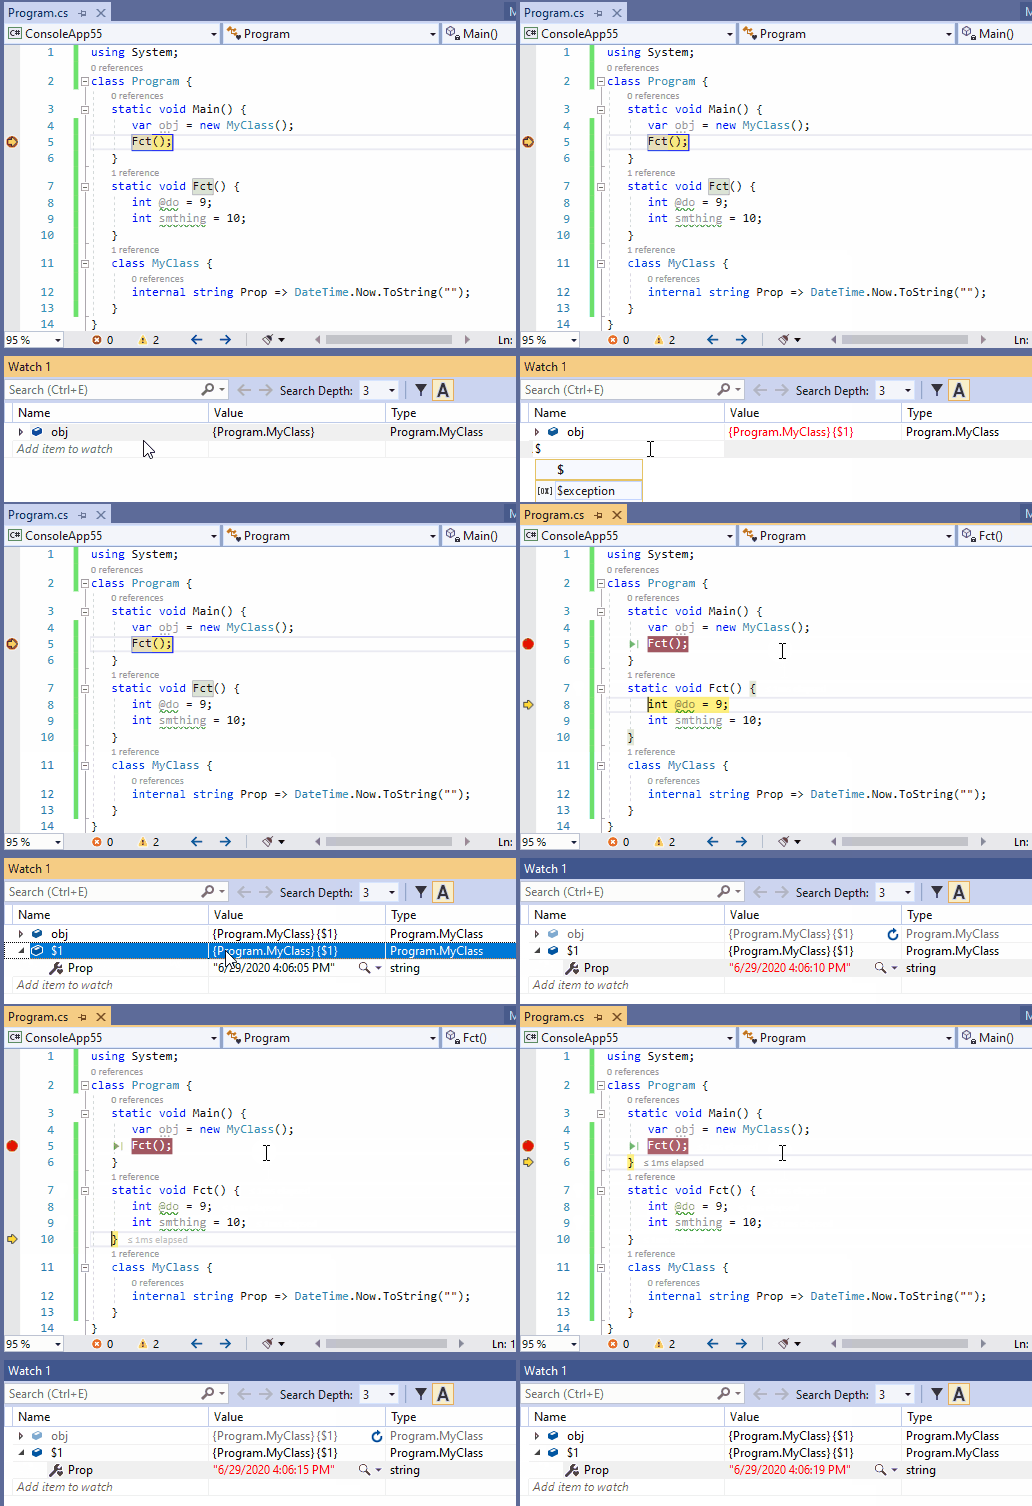
In the Watch window objects are tracked by the name of their references in the currently executed scope. However when such tracked reference goes out-of-scope, it becomes meaningless in the context of the Watch window and it gets disabled, even though the referenced object is still live.
There are many situations where we’d like to continue tracking the state of an out-of-scope object. To do so, right click such reference in the Watch window, click the menu Make Object ID and add $1 in the items to watch (or $2 or $3… depending on how many object IDs you’ve already created).
The animation belows shows how to track the state of an out-of-scope object’s property getter that returns the actual date-time as a string. It shows well that when the reference obj goes out-of-scope in the context of Fct(), obj item to watch gets disabled and $1.Prop still gets updated.
8) View values returned by functions
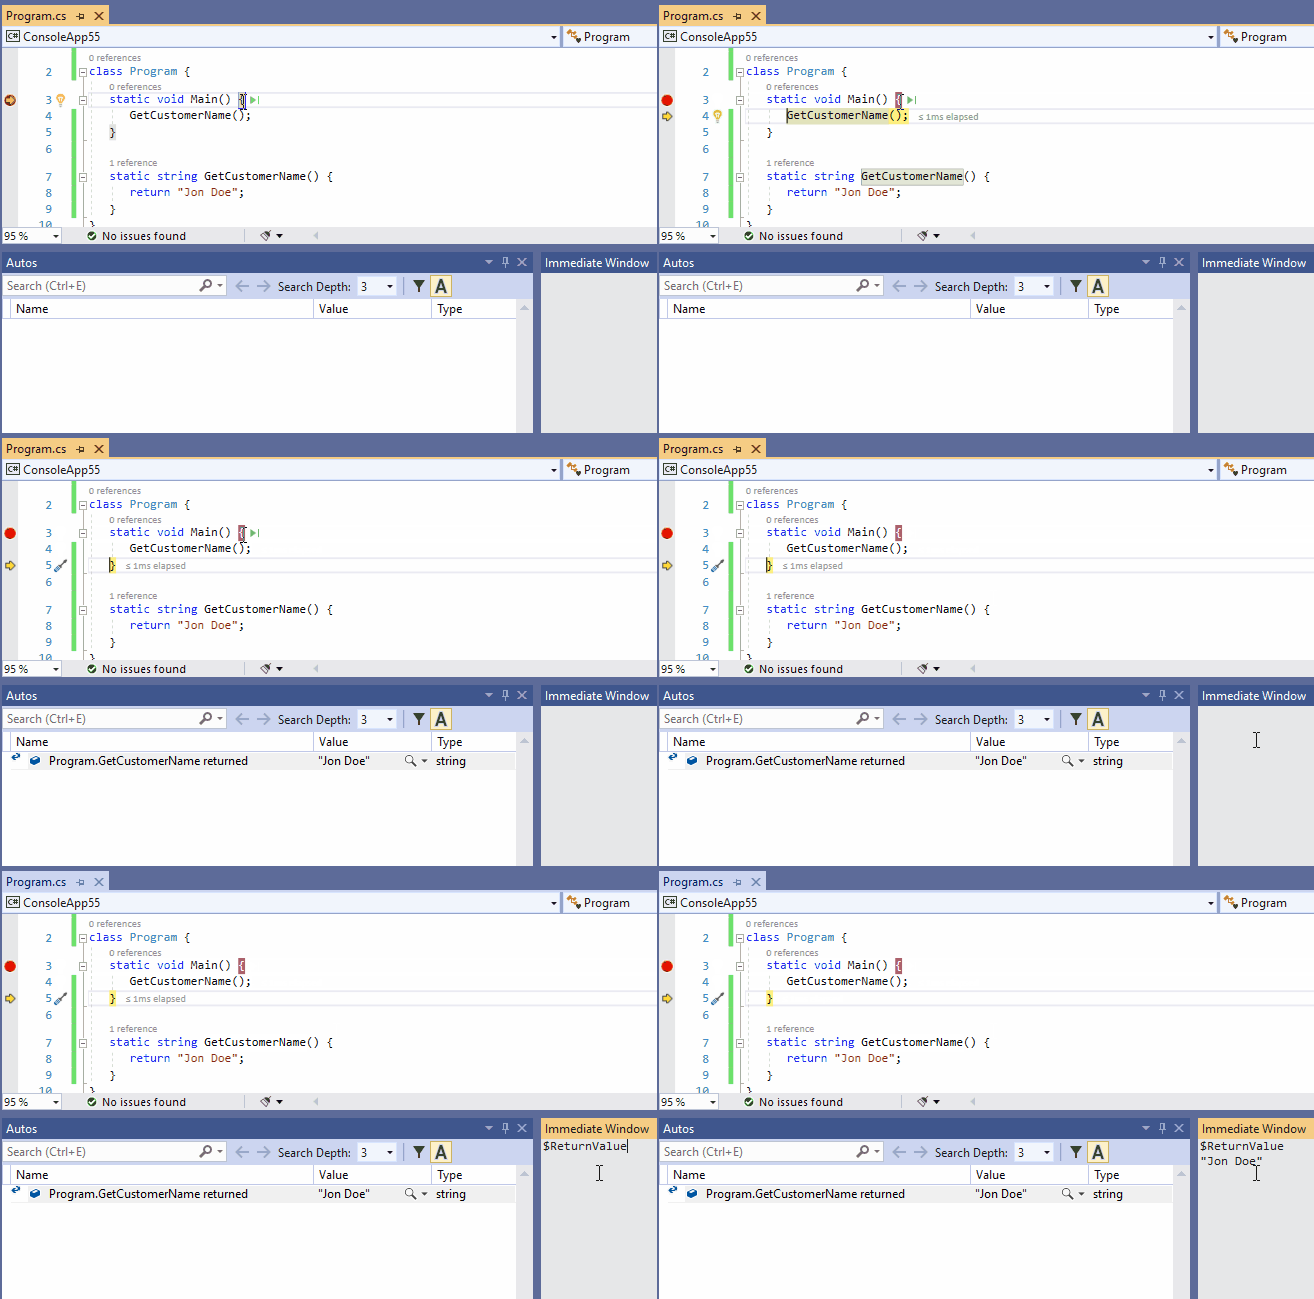
The value returned by a function is sometime ignored by the source code. Or sometime this value is just not obviously accessible at debug-time.
Such returned value can be shown in the Debug > Windows > Autos windows. The pseudovariables $ReturnValue can also be used in the Immediate and Watch Windows to view the last function call returned value.
Note that the menu Debug > Windows > Autos is available only when the Visual Studio debugger is attached to a process and the program is halted by the debugger.
9) Reattach To Process
Since Visual Studio 2017 the Reattach to process Shift+Alt+P facility is proposed and it’s very handy. Once you’ve been attaching the debugger to a process Visual Studio remembers it and proposes to re-attach the debugger to the same process. Same is in italic because there is an heuristic here about the process identity:
- If the process you’ve been attached to is still alive Reattach to process re-attach to it.
- Else Visual Studio attempts to find a single process with the same previous process name and re-attach the debugger to it.
- If several processes are found with this name, the Attach to Process dialog is opened with only those processes with same name shown
- If no process with this name can be found the Attach to Process dialog is shown
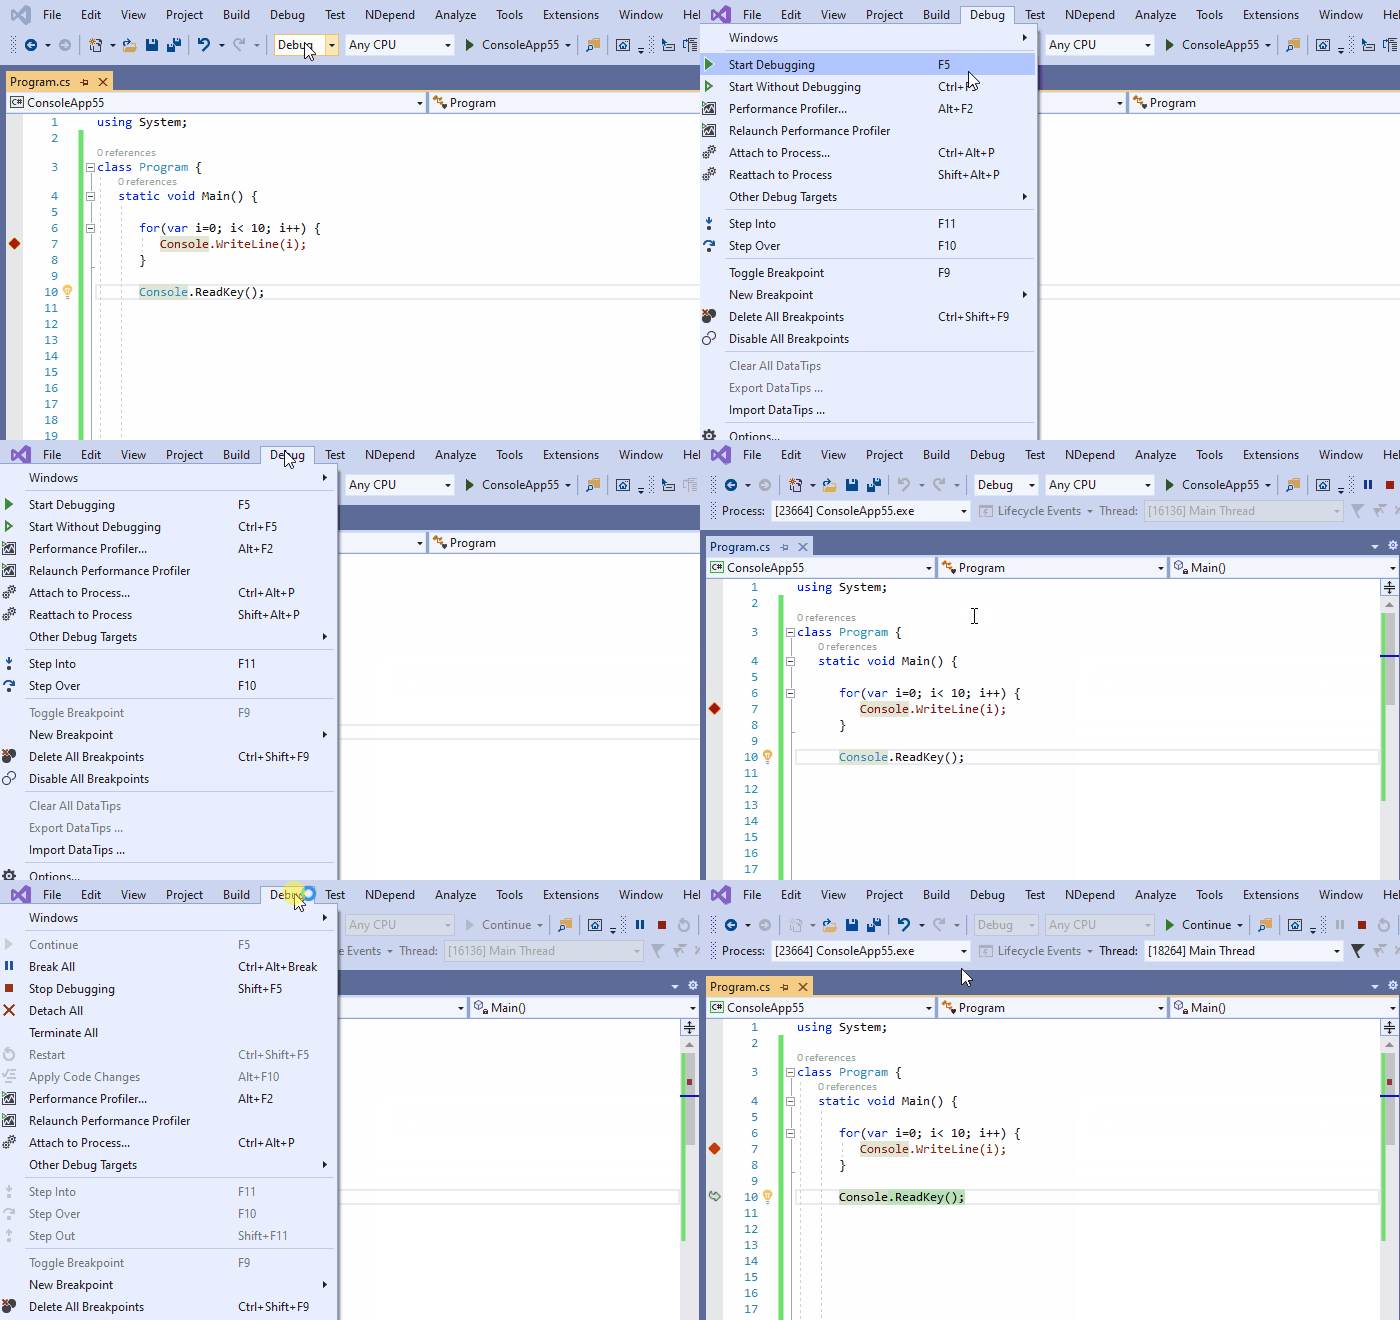
Reattach To Process also works with debug session involving multiple processes. In this situation Visual Studio attempts to find all processes it has been attached to with the same heuristics explained above.
10) No-Side-Effect evaluation in Immediate Window and in the Watch Window
Sometime when evaluating an expression in the Immediate or in the Watch window some state gets changed. This behavior is often indesirable, you don’t want to corrupt the state of your debugged program just because you needed to evaluate the value of an expression. This situation is known as an Heisenbug , the term is a pun on the name of Werner Heisenberg, the physicist who first asserted the observer effect of quantum mechanics, which states that the act of observing a system inevitably alters its state.
To avoid changing any state you can suffix your expression with , nse (No-Side-Effect). This possibility is illustrated by the animation below (watch the _State value changing or not in the Watchwindow):
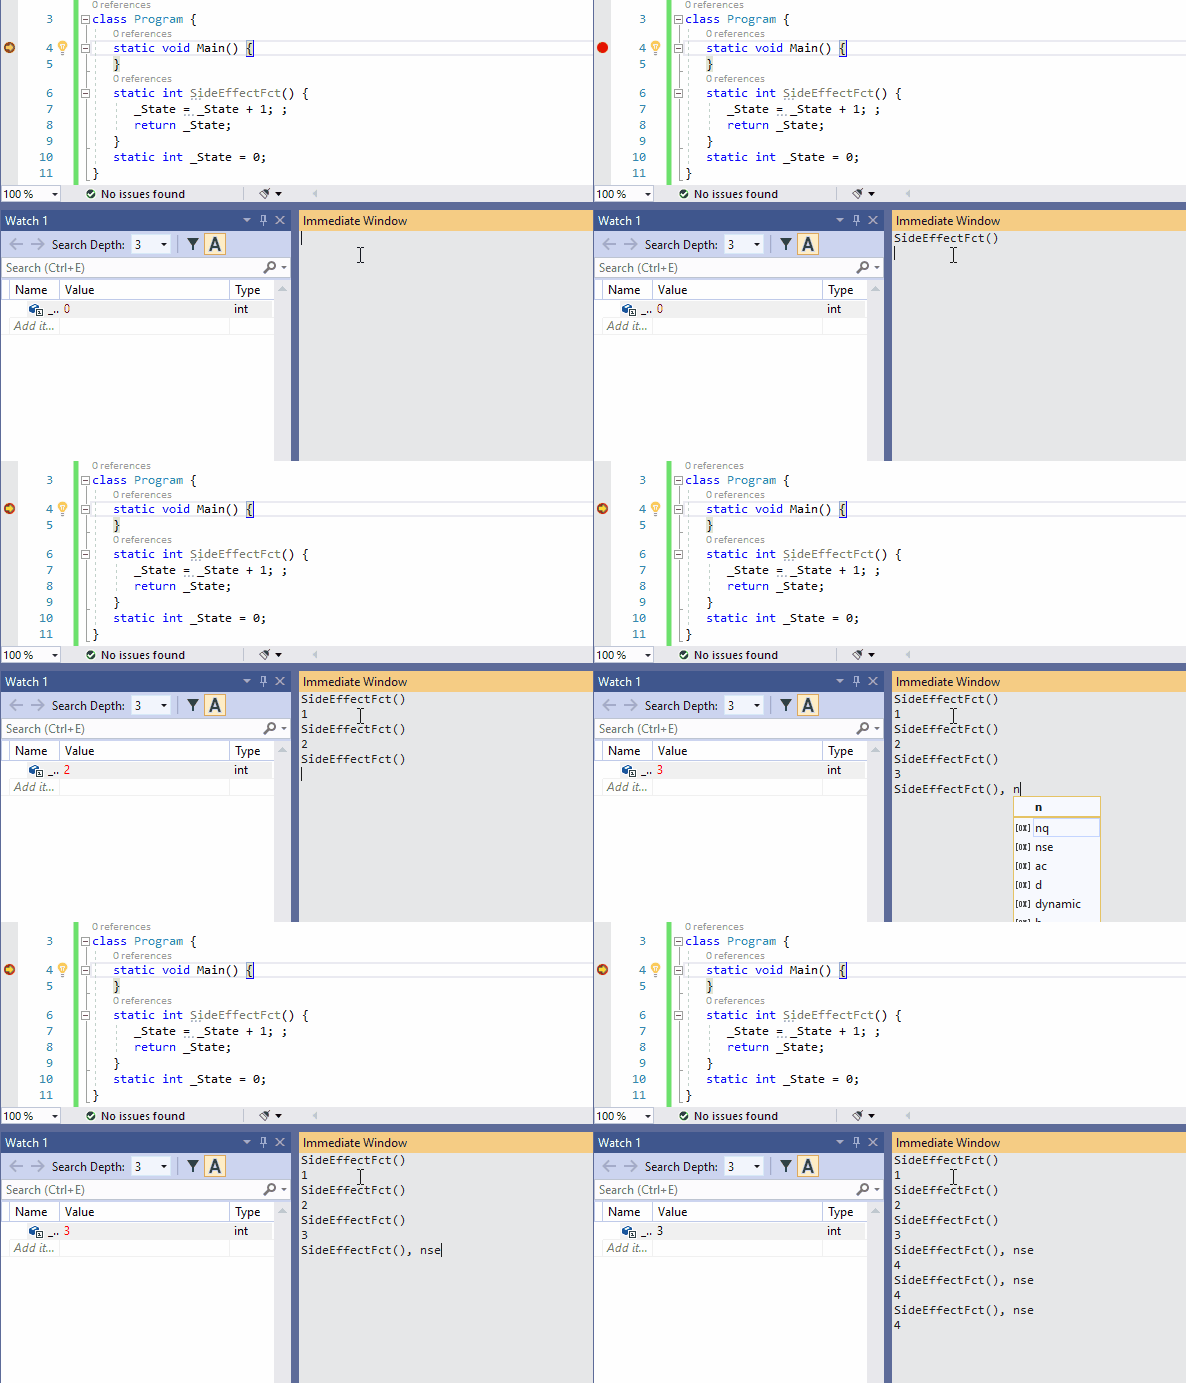
Here is ,nse used in the Watch window. This sample is less trivial than the previous one because of the Refresh evaluation button in the SideEffectFct() watched item.

11) Show Threads in Source
Debugging a multithreaded application is notoriously complex. Hopefully the Show Threads in Source button can help a lot. It introduces marker icons in the editor gutter to keep track of the locations on which other threads are halted. This marker can be used to show the thread ids and eventually switch to another thread. Notice that a different marker glyph is shown if at least two threads are halted on the same location.

More tips to debug multithreaded applications are available in this Microsoft documentation: Get started debugging multithreaded applications (C#, Visual Basic, C++)
Here is the source code of this small demo if you’d like to play with it:
12) Debug source code decompiled from IL code
Often we depend on some black-box components: assemblies for which we don’t have the source code.
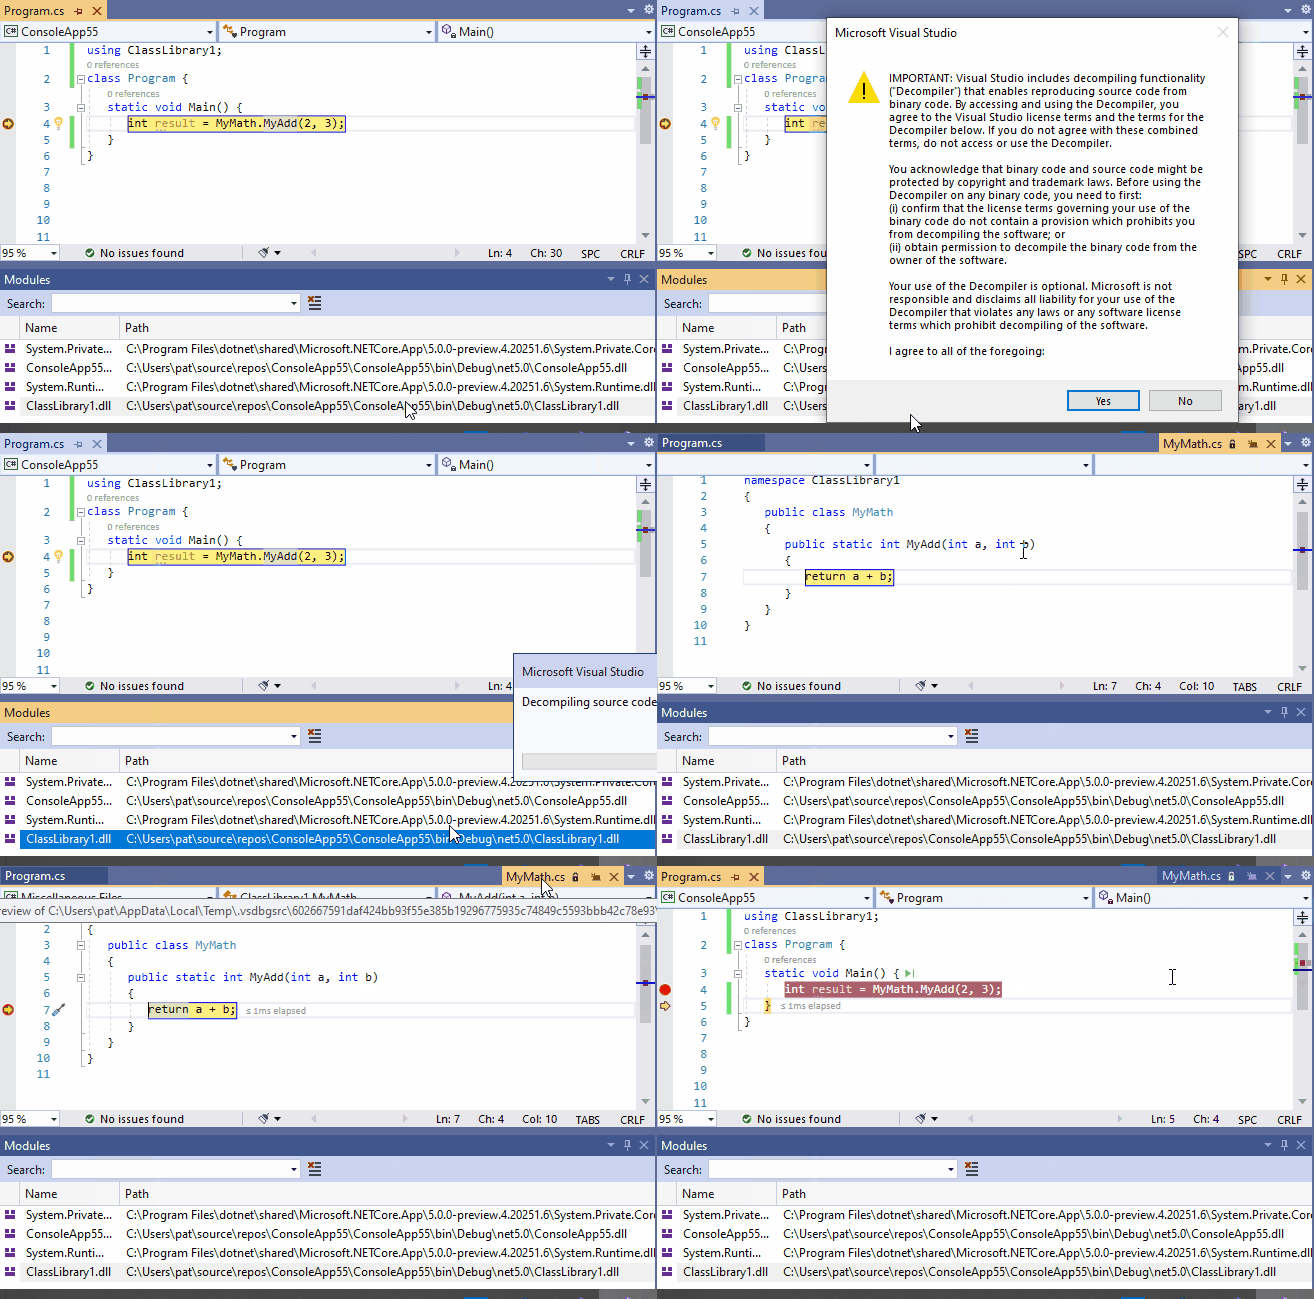
However when debugging a complex behavior it is convenient to observe and even debug the logic nested in black-boxes referenced. This is why since version 16.5 Visual Studio 2019 can generate some source code from compiled assemblies. Such source code is then debuggable. This feature is based on the OSS project ILSpy.
The decompilation menu can be proposed in the assembly right-click menu in the Modules window (as shown in the animation below) and in the Source Not Found or No Symbols Loaded dialogs.
Decompiling IL code to source code cannot be perfect because some source information is lost at compilation time. Hence this feature has a few limitations explained at the end of this official documentation: Generate source code from .NET assemblies while debugging.
Conclusion
Visual Studio shines but it especially shines when it comes to debugging. Here I tried to select some tips that are both quite hidden but often useful, I hope they will help improve your productivity.
Comments | NOTHING